Point Cloud Tools for 3D Studio [Project Helix]

Bring your visualizations into context with Project Helix, a powerful technology prototype enabling display and rendering of 3D laser scanning/LiDAR data sets with Autodesk® 3ds Max® and Autodesk® 3ds Max® Design software. With the 3ds Max Point Cloud Tools you can more quickly import as-built site references to help evaluate and visualize your designs in context of their surrounding elements. Point cloud data sets are often created by 3D scanners and represent set of measured vertices in a three-dimensional coordinate system. Using an automatic process, these devices measure in a large number of points on the surface of an object and output a point cloud as a data file. Download Now

The Point Cloud Tool for 3ds Max and 3ds Max Design allows you to:

  • Import .PTS format point cloud data into 3ds Max or 3ds Max Design scenes (release 2010 & 2011)
  • Display the point cloud data in the 3ds Max viewport with a variety of rendering options and levels of detail
  • Render point clouds using the mental ray® renderer*
  • Slice point clouds into pieces using geometric display volumes
  • Export multiple clouds or parts of clouds to new .PTS files

* mental ray is a registered trademark of mental images GmbH licensed for use by Autodesk, Inc.

The Project Helix Technology Preview will be made available only for a limited time, so download Project Helix before June 20, 2011 and place your designs in context today!

If you would like to try the Point Cloud Tool for 3ds Max with a sample data set:


FEATURED VIDEOS

If you do not have access to YouTube videos, you can download the video from as 3ds Max Point Cloud Tools.mp4.

Point Cloud Shape Extraction for AutoCAD Plug-in

The Point Cloud Shape Extraction for AutoCAD Plug-in is an intelligent point cloud shape extraction solution which allows you to import, load, and extract shape and geometry information from point cloud data in AutoCAD. Once installed, the tools for point cloud shape extraction are located in Point Cloud tab on the ribbon user interface. Download Now

Sample Data

To experiment with Shape Extraction for AutoCAD, you can download some sample data. The zip file contains 5 samples: Cup.pcg, Football.pcg, Mandalay.pcg, Pipe.pcg, and Room.pcg.

Availability

To ensure the best experience for those participating, this technology preview is currently limited to: Australia, Canada, Ireland, New Zealand, Singapore, United Kingdom, and United States. We hope to expand to other geographies in the future.

The Shape Extraction for AutoCAD technology preview is licensed for a limited term and for a particular territory as referenced in the End User License Agreement. The technology preview will operate until February 1, 2011.

For those without YouTube access, the videos are available for download via this blog article.

Google Maps Street View 2.0 [LiDAR]

Brian Ussery is reporting that Google is back in Atlanta, GA making Street View images for Google Maps but, this time they brought in the big guns. Beu Blog reported on April 28, 2010, “The cars here today are equipped with GPS, high resolution panoramic cameras and multiple SICK sensors. These sensors collect LiDAR data that can be used for 3D imaging and visualizations like that seen in Radiohead’s recent “House of Cards” music video. Google Earth and SketchUp, Google’s 3D virtual building maker for Maps also use this type of data.

Last week Google announced the release of a plugin which allows users access to Google Earth imagery via Maps. As a result it’s now possible to view 3d images in Google Maps. The problem here is fairly obvious, Google Earth’s aerial imagery is taken from above and as a result not from the same perspective as users interacting with the data. Not to worry though, the StreetView team has been working on these kinds of problems for some time. When it comes to Navigation, Maps or StreetView, earthbound LiDAR enhanced imagery processed via Sketchup seems like a perfect complement to Google’s existing view from above. Combining high resolution imagery taken from the user’s perspective with advanced 3D image technology, presents some new possibilities to say the least. Factor in new releases like business ads in Maps, now being available in 3D on your mobile device and it’s pretty clear how Sketchup will be monetized.”

It is expected that Google’s incorporation of LiDAR into their mapping efforts will lead to some significant changes to our industry. If you have not previously seen the “House of Cards” video, be sure to check out the interactive music video code to see how Google made the point cloud data readily available for manipulation in a standard web browser. Point clouds are finally becoming more natively accepted in most CAD platforms and with Google getting involved in the industry, who knows where we will be in the near future.

European LiDAR Mapping Forum

Title: European LiDAR Mapping Forum
Location: The Hague Netherlands
Link out: Click here
Description: The European event for airborne, bathymetric and terrestrial LiDAR, with a particular focus on mobile mapping systems.

A major, two day technical conference focusing on the use of LiDAR to support transport, urban modelling, coastal zone mapping, asset management and GIS applications.

Alongside there is an associated international exhibition for system and component manufacturers, operators and service companies.

Building on 10 years of experience with the annual International LiDAR Mapping Forum (ILMF) in the USA, the organizers are bringing this unique event to Europe. With its focus on LiDAR technology and applications, ELMF10 recognizes the technology advances spearheaded in Europe, and the particular challenges and opportunities which face operators in applying LiDAR to new developments in the European market.

The ELMF10 theme is “LiDAR Across The Market Spectrum”, and the conference programme will feature technical presentations by the industry leaders and opinion formers.

Start Date: 2010-11-30
End Date: 2010-12-01

Tiltan TLiD Transform LiDAR Point Clouds to 3D Models in One Keystroke

From Tiltan’s website: TLiD is Tiltan’s innovative solution for fast, automated creation of 3D maps and GIS information from LiDAR point clouds.

TLiD Main Features:

– Automatic extraction of DTM (bare earth) and DSM
– Automatic features extraction (houses, trees, power lines)
– Automatic full scene 3D reconstruction
– LAS or free ASCII txt input
– LAS, SHP, DTM and other output file formats
– Multiple input/output coordinate systems
– Integrated with a 3D Viewer

TLiD Advantages:

– Fast parallel processing for cost reduction
– No limitation on input file size
– Standalone product
– Special Applications
– Trees counting – height and size
– Power line mapping and clearance
– Line of sight
– Other applications – available on request

Exploring Point-Based Rendering in Pixar’s RenderMan [Point Clouds]

Creating animations of large point cloud datasets generated from terrestrial laser scanners and LiDAR has been an issue for a number of years. While it has been possible using tools such as Leica Geosystems Cyclone or Pointools, just to name a couple, it is still a very cumbersome task. It is exciting to see the CGI industry beginning to adopt the use of this data and developing applications that make it easier to visualize.

Over the last few years, a brand new technology has emerged for creating CGI effects that has already made a big impact on feature film production. It is called point-based rendering, and this powerful technique makes creating global illumination effects for feature film far more practical and efficient than before. In fact, this year the Academy of Motion Picture Art and Sciences awarded the creators of this innovation, Per Christensen, Michael Bunnell and Christophe Hery, with a Scientific and Engineering Academy award.

In this great article written by Nils O Sandys at CGSociety, we will look into the development of this important new technology, how point-based rendering works, and what this all means to the future of feature film production as we know it. Read the full article here.

National Center for Airborne Laser Mapping Comes to Houston [LiDAR]

April 12, 2010 – Houston – Increasing its cadre of laser mapping researchers, the University of Houston will expand its pioneering work in such areas as homeland security, disaster recovery, oil and gas exploration, wind farm site planning and environmental studies.

The NSF National Center for Airborne Laser Mapping (NCALM) and the groundbreaking researcher leading it recently moved operations to the University of Houston.  Based upon historical information, revenues generated by the center’s operation are anticipated to be $1 million per year and will be reinvested in the program.

NCALM is UH’s first and only NSF-supported center, established and sustained by funding from the National Science Foundation.  This differs from the way the university typically sets up centers, using university funds or grants from multiple sources for multiple projects.  These types of centers support NSF’s focus on interdisciplinary research, spanning several institutions and departments.

Ramesh Shrestha, Hugh Roy and Lillie Cranz Cullen Distinguished Professor of Civil and Environmental Engineering, brought NCALM to UH from the University of Florida.  He has been director of the center, focused on ground-based scanning laser technology and airborne laser swath mapping research, since it was established in 2003.  Shrestha brought much of his Florida team with him to Houston, where they now operate NCALM jointly with the University of California-Berkley.

“With the center, we have brought laser mapping’s uses to the forefront and expect to continue to have this impact in our new Houston home,” Shrestha said.  “We plan to establish curriculum catered to this specialty and eventually add a graduate degree in geosensing systems engineering.  This is in addition to carrying out research far surpassing what is capable in laser mapping to date.”

Shrestha’s work with laser mapping goes back to the 1990s, when this once niche research area was just making its debut.  Bill Carter, now a research professor at UH, worked with him early on and helped establish NCALM.

“Together, we saw its potential to far exceed what was possible with many traditional methods, such as airborne photogrammetric mapping that uses cameras to detail terrain,” Carter said.  “Laser mapping has the ability to work day or night, as well as generally map areas even though they were covered by forests and other vegetation where photogrammetric methods couldn’t.”

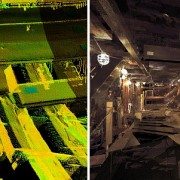
It wasn’t long before other scientists would see its same benefits, especially as the two developed techniques to remove and minimize some of the errors seen in the early years.  Their equipment became fine-tuned to collect even more data, now mapping as many as 167,000 points per second compared to the 3,000 they were able to achieve when they first started.

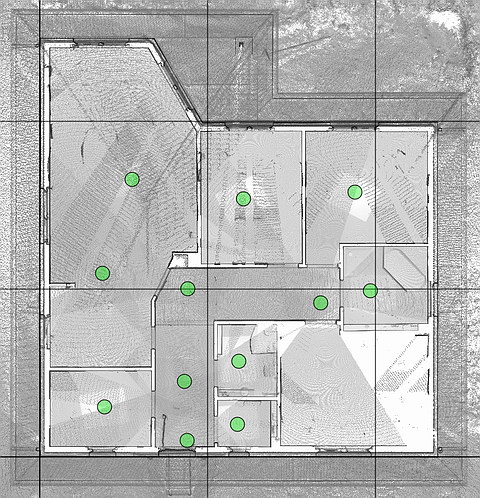
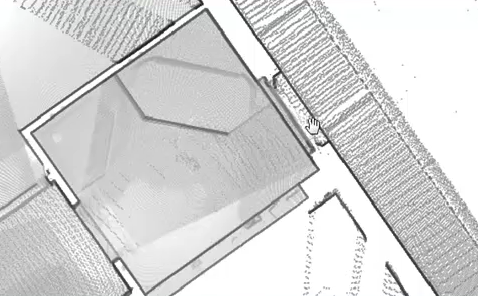
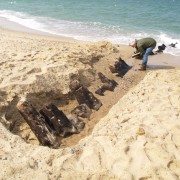
Their work has changed the way the state of Florida monitors erosion on its coastline, produced the highest resolution 3-D images in existence of the San Andreas Fault and taken them across the globe to map Mayan Ruins in Belize and volcanoes in Hawaii.  While the impact of their work is already far reaching, their plan for the coming years indicates they are not close to completion.  The value of this work is evident in evaluating the before and after of hurricanes and earthquakes in terms of improving building design and other mitigation efforts, as well as offering predictive tools for subsequent powerful events.

Aided by NSF, future NCALM efforts explore the possibility of using Light Detection and Ranging (LiDAR) to map everything from glacial movements to the migration of penguin colonies in Antarctica.  Using LiDAR, researchers take measurements of the ground’s surface from their Cessna 337 Skymaster airplane.

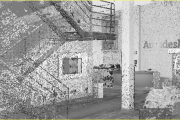
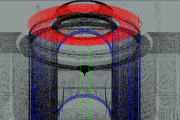
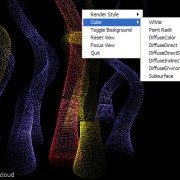
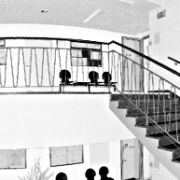
From roughly 2,000 feet, this remote technology measures properties of scattered light through the use of laser pulses.  Thousands of small cone-shaped pulses travel through a hole in the bottom of the plane to the ground below, and a unique detector picks up rays reflected from the ground.  Then, each point’s distance is determined by measuring the time delay between the transmission of a pulse and the detection of reflected signals.  The plane’s location and movement in the air are tracked by an inertial measurement unit fixed inside the laser system with a GPS receiver mounted to the plane and others on the ground.  Both are used, along with the laser data, to produce detailed 3-D topographical images of the terrain.

“In coming years, our group plans to develop a next-generation LiDAR system.  The unit would be less expensive than commercially available systems and allow for some of the most accurate, highest-resolution observations possible in laser mapping,” Shretha said.  “We want to develop a system like no one else has developed.  It would really change what could be done with this technology.  It would have new features, be faster, smaller and capture more during each flight than we can today.”

According to Shrestha, this system would use a much shorter pulse-length laser, increasing the number of points that could be mapped per second to 800,000.  This would add to data accuracy and reduce the amount of time needed in the air to collect the information.  Additionally, it would be able, for the first time, to penetrate shallow water depths.

###

NOTE TO JOURNALISTS: High-resolution photos of Ramesh Shretha and the Cessna 337 Skymaster airplane are available to media by contacting Lisa Merkl.

About the University of Houston
The University of Houston, Texas’ premier metropolitan research and teaching institution, is home to more than 40 research centers and institutes and sponsors more than 300 partnerships with corporate, civic and governmental entities.  UH, the most diverse research university in the country, stands at the forefront of education, research and service with more than 37,000 students.

About the Cullen College of Engineering
The Cullen College of Engineering at UH has played a vitally important role in educating engineers in Texas.  Taught by innovative faculty, eight of whom are in the National Academy of Engineering, the college offers degree programs in biomedical, chemical, civil, computer, electrical, environmental, industrial, mechanical and petroleum engineering, as well as specialty programs in materials, aerospace, and computer and systems engineering.

For more information about UH, visit the university’s Newsroom at http://www.uh.edu/news-events/.

To receive UH science news via e-mail, visit http://www.uh.edu/news-events/mailing-lists/sciencelistserv.php.

For additional news alerts about UH, follow us on Facebook and Twitter.

Create Floor Plans Automatically from 3D Point Clouds [Point-Cab]

SCANable is evaluating this promising new software and will follow-up with an indepth review in the coming days. In the meantime, please feel free to check it out for yourself and leave your input here.

Automatic analysis and interpretation of laser scanning data

  • Floor plans, views and sectional views are created at the push of a button.
  • Program offers an intuitive user interface (no training required).
  • For the first time, results can be processed in almost all CAD programs.
  • Visual representations allow a direct use and will dramatically reduce time needed for analysis and modeling.


Point-Cab is the first application that automatically creates―at the push of a button―floor plans and sectional views. The goal of the development team has been to create an extremely user-friendly interface design.

The program creates a visual representation of laser scanning data. The result has much more expressiveness and validity than individual points of point clouds. Images and representations of sections are a prerequisite for an easy modeling in CAD programs.

The program supports most of the common CAD programs and construction tools through standard interfaces. You may use the results in ArchiCAD, Google SketchUp, Revit and other tools.

Point-Cab product videos

Get to the video:

Creation of a floor plan at the push of a button

Get to the video:

Sectional views created from laser scanning data

Point-Cab supports several CAD programs, such as:

    • AutoCAD
    • ArchiCAD
    • Microstation
    • SketchUp

Point-Cab Layout supports the following laser scanner formats:

    • PTX exchange format
    • FARO laser scanner
    • Riegl laser scanner (available soon)

Examples of use

Point-Cab Layout transfers laser scanning data into AutoCAD (available soon)

Point-Cab transfers laser scanning data into ArchiCAD (available soon)

Point-Cab transfers laser scanning data into Microstation (available soon)

Point-Cab transfers laser scanning data into SketchUp

Point-Cab Layout trial version

Find out for yourself why this revolutionary program can make such a difference for you.Click here to download the Point-Cab trial version. The trial version can be used for 15 hours. Time is consumed when you use the application. Feel free to also download our laser scanning data examples. Please find all data examples here.

Here you can download the processed layout results of the full version of Point-Cab.

Buy Point-Cab Layout

Click here or send email to info@laserscanning-europe.com.

Digitally Preserving American History

Erosion from recent storms uncovered the wreck by Harry R. Feldman Inc.

It is great to finally see people accepting the benefits of laser scanning as a means of digital preservation. Below is an excellent article posted by by Stefanie Geisler, Boston Globe Correspondent. Source

The wreck of the British warship that Paul Revere slipped by on his legendary journey to Lexington in 1775 has resurfaced in the shifting sands of Cape Cod, and federal park officials are seizing the moment by having the wreck “digitally preserved,” using three-dimensional imaging technology.

“We know the wreck is going to disappear again under the sand, and it may not resurface again in our lifetimes,” said William P. Burke, the historian at the Cape Cod National Seashore, noting that the last time any part of the HMS Somerset III had been sighted was 37 years ago.

“Somewhere down the road, if someone’s researching the Somerset, or the effects of ocean currents on shipwrecks, or anything like that, they will have this record,” he said. “We’re in the forever business. We’re looking at tomorrow, but we’re also looking ahead indefinitely.”

The Somerset fought in the American Revolution and had a crew of more than 400. In 1775, Paul Revere slipped through Boston Harbor past the ship before beginning his ride to warn the colonials the British were on the move. In his poem “Paul Revere’s Ride,” Henry Wadsworth Longfellow called it “a phantom ship, with each mast and spar/Across the moon like a prison bar.” The ship sank on Nov. 2, 1778 off the Cape.

After erosion from recent storms, about a dozen of the Somerset’s timbers were found poking through the wet sand at low tide in the national seashore in Provincetown. Park officials called on Harry R. Feldman Inc., a land surveying company from Boston, to make the three-dimensional rendering.

On Thursday, crews set up survey markers and a laser scanning instrument, said Michael Feldman, the company’s president.

The instrument was placed near the timbers, Feldman said. Using the scanner, the surveyors collect millions of data points that are used to create the three-dimensional rendering.

“The great thing about this technology is it not only shows a three-dimensional picture or video of what’s there, it also obtains data down to quarter-inch accuracy,” Feldman said.

It could take several visits to the site to complete the imaging. But when it’s done, the national seashore will have an animated fly-through of the wreck site — and anyone interested in seeing it won’t have to wait for the timbers to reappear.

The imaging will only capture the timbers that are showing. The rest of the wreck, which is buried in sand, might deteriorate if the site were excavated, Burke said.

Most of the crew survived when the ship sank, but they didn’t get a warm welcome when they reached the shore, he said.

“They were pretty upset with them, because the British had been blockading Provincetown for a long time during the war,” Burke said. “They marched all the survivors off the Cape, and eventually exchanged them for American prisoners.”

Laser Scanning the Hold of the Charles W. Morgan

In an effort to precisely document the measurements of the Charles W. Morgan, Feldman Land Surveyors from Boston, MA used a Leica Geosystems ScanStation 2 3D laser scanner to create a photo-realistic 3-D model of the ships hold.

History
Charles W. Morgan was a U.S. whaleship during the 19th and early 20th century. Ships of this type usually harvested the blubber of whales for whale oil, which was commonly used in lamps during the time period. The ship is currently an exhibit at the Mystic Seaport museum in Mystic, Connecticut.

The ship is named for its original owner, a Quaker whaling merchant who ordered its construction from the shipbuilders Jethro and Zachariah Hillman of New Bedford, Massachusetts. The ship’s maiden voyage began on September 6, 1841, with a journey around Cape Horn and cruised across the Pacific Ocean. Following the Morgan’s initial three year and four month voyage, she came home with 1,600 barrels of sperm oil, 800 barrels of whale oil and 10,000 lbs of whalebone, known as baleen, which was worth around USD$56,000.

The hull and deck of Morgan reflected the industry which she was built to serve. A typical whaleship has three functions:

  • to serve as a mother ship to a fleet of small whaleboats, which are stored on the davits when not in use,
  • to serve as a factory and a refinery ship with tryworks for extracting oil from the whale blubber,
  • to serve as oil tankers.

In her 80 years of service, she made 37 voyages ranging in length from nine months to five years. Charles W. Morgan, in total, brought home 54,483 barrels of sperm whale oil and 152,934 pounds of whalebone. She sailed in the Indian and South Atlantic Oceans, surviving ice and snow storms. Her crew survived a cannibal attack in the South Pacific. Between 1888 and 1904 she was based in San Francisco.

Morgan had more than 1,000 whalemen of all races and nationalities in her lifetime. Her crew included not only Americans, but sailors from Cape Verde, New Zealand, the Seychelles, Guadeloupe, and Norfolk Island. The ship’s crew averaged around 33 men per voyage. As with other whaleships in the 1800s, Morgan often was home to the captain’s family. The Morgan was owned and managed by the J. & W. R. Wing Company of New Bedford.[3]

During its years of service, Charles W. Morgan was used in several movies, including Miss Petticoats (1916), Java Head (1921) and Down to the Sea in Ships (1922).

On the night of June 30, 1924, the Charles W. Morgan caught fire when the flaming wreck of the steamer Sankaty, which had drifted across the Acushnet River from New Bedford harbor in flames, collided with it. Badly charred, Morgan narrowly escaped destruction.[4][5][6]

One of the Charles W. Morgan’s whaleboats, featuring models of crew members with oars and harpoons.

Retirement
The whaling days came to an end with the perfection of refining petroleum. Morgan was under the care of Whaling Enshrined, Inc. until 1941, when she was transferred to Mystic Seaport, where she still stands to this day. The ship is the only surviving wooden whaleship from the 1800s American fleet.[7]

Restoration
The 1971 U.S. commemorative stamp honoring the Charles W. Morgan

The Charles W. Morgan arrived at Mystic Seaport in December 1941, narrowly avoiding destruction during World War II. The ship was declared a National Historic Landmark and listed on the National Register of Historic Places in 1966.[2][7][8]

An initial restoration and preservation project was undertaken in 1968. A new restoration effort took place in 2009.
Mystic Seaport has recently completed a multi-million dollar shipyard upgrade to accommodate the next phase of Morgan’s restoration, which is currently underway.

In 1971, the United States Postal Service issued a commemorative stamp honoring the Charles W. Morgan.

Laser Scanning blends highly accurate measurements with three dimension expression of the space and the relationship among the various structural elements. It not only gives us a record of the vessel but has tremendous value as an educational tool describing the structure to those not familiar with traditional naval architectural drawings.